Cisco Firepower/FTD: How to see Cisco FTD Lina events
So many customers and students ask me about how to see the NAT events in their FMC and my answer is no way, nada, nope – not going to happen.
By looking at the detailed packet flow of Cisco FTD devices posted in an earlier post, we can understand why we can’t see the Lina events in the Firepower Management Center (FMC) since the FMC only records Snort events, and not what happened before the Snort engine analysis. Here is the FTD packet flow blog: Cisco FTD Packet Flow
There are two ways to get Lina events: from the CLI of the FTD box with the show logging command, but if you don’t want to watch your CLI 24×7, you can setup a syslog server connection to your FTD. To configure your FTD device(s) to log Lina events, go to Devices>Platform Settings>Syslog on your FMC.
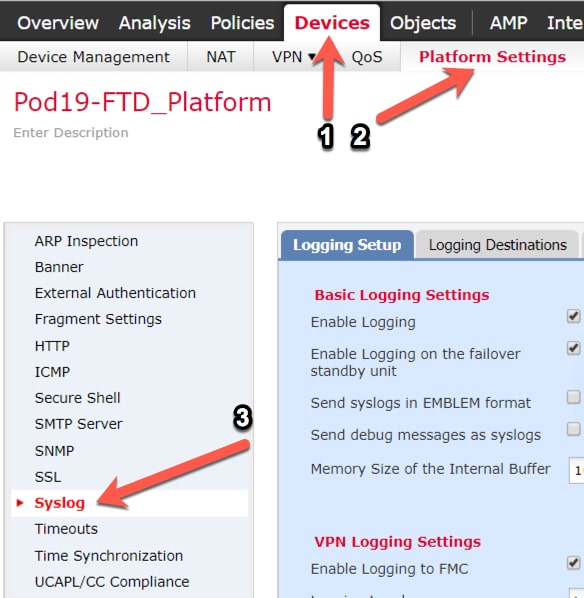
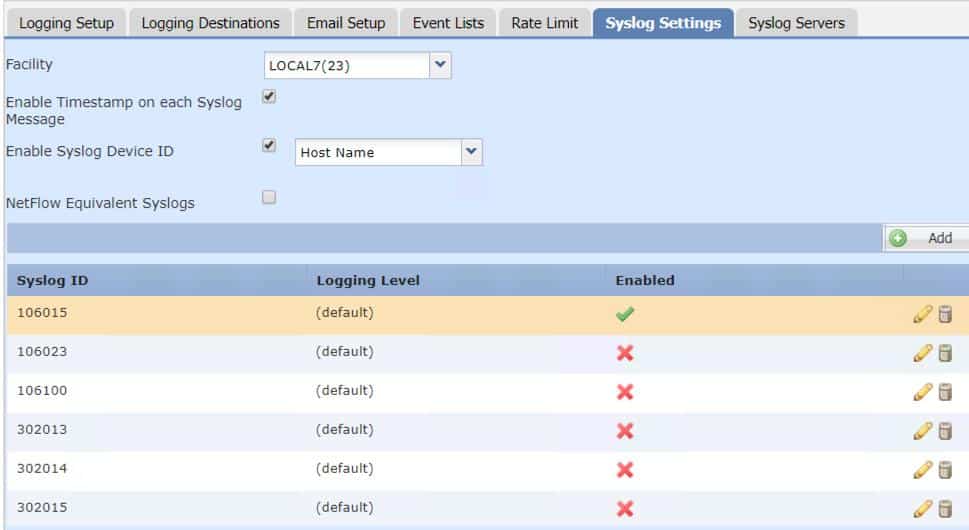
From here there are quite a few settings for Syslog and you’ll have to figure them out based on your own network, but I do want to bring something to your attention, and that is the Syslog Settings tab.
These Syslog ID’s can be hard to figure out and they are all disabled by default, which is probably not what you want.
So, what are these numbers? That’s a good questions and here is the answer:
https://www.cisco.com/c/en/us/td/docs/security/asa/syslog/b_syslog.html
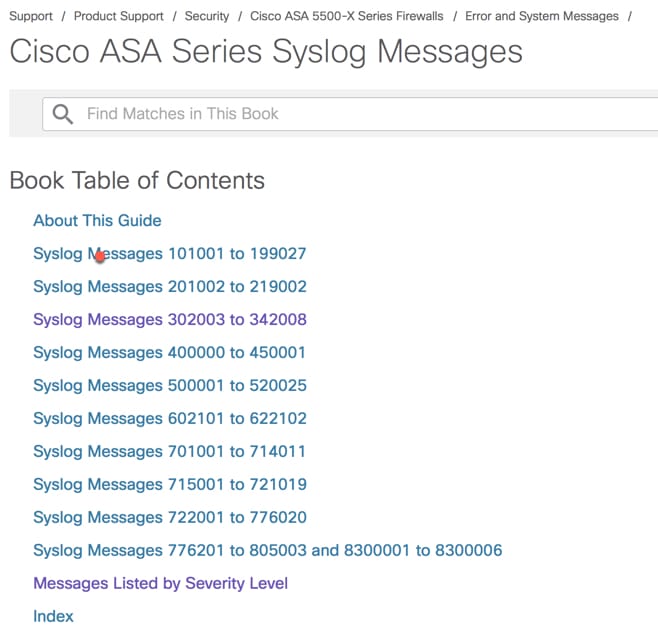
Its recommended to look at the Messages listed by Severity Level, which is highly informative. Here is a small example, and there are hundreds of pages of output you can search through:
- %ASA-1-105002: (Primary) Enabling failover.
- %ASA-1-105003: (Primary) Monitoring on interface interface_name waiting
FTD Logging
- When a user configures FTD logging from Platform Settings, the FTD generates Syslog messages (same as on classic ASA) and can use any Data Interface as a source (including the Diagnostic). Here is an example of the FTD sending a Syslog message via the platform settings direct to the Syslog server:

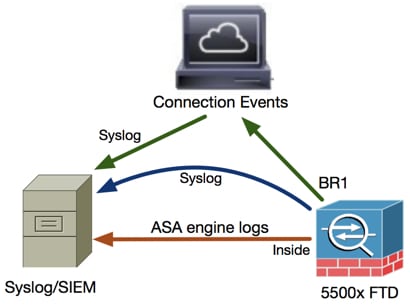
- However, when Access Control Policy (ACP) Rule-level logging is enabled the FTD originates these logs through the br1 logical interface as a source. The logs are originated from the FTD br1 subinterface:
Step 1. Log in to the FTD console or SSH to the br1 interface and enable capture on FTD CLISH mode using no filter
> capture-traffic
Please choose domain to capture traffic from:
0 – br1
1 – Router
Selection? 1
> support-system capture-traffic
> show capture
Also, from your FTD console, you can use the typical ASA commands to see information and logs:
>show logging
Syslog logging: enabled
Facility: 23
Timestamp logging: enabled
Hide Username logging: enabled
Standby logging: enabled
Debug-trace logging: disabled
Console logging: disabled
Monitor logging: disabled
Buffer logging: level debugging, 6581321 messages logged
Trap logging: level debugging, facility 23, 13149628 messages logged
Logging to Inside 10.11.11.250, UDP TX:8317
Global TCP syslog stats::
NOT_PUTABLE: 0, ALL_CHANNEL_DOWN: 0
CHANNEL_FLAP_CNT: 0, SYSLOG_PKT_LOSS: 0
PARTIAL_REWRITE_CNT: 0
Permit-hostdown logging: disabled
History logging: disabled
Device ID: hostname “ftd19”
Mail logging: disabled
ASDM logging: disabled
FMC logging: list MANAGER_VPN_EVENT_LIST, 0 messages logged
utside:224.0.0.10
May 17 2018 21:16:43 ftd19 : %ASA-7-710006: EIGRP request discarded from 10.11.12.160 to Outside:224.0.0.10
May 17 2018 21:16:43 ftd19 : %ASA-7-710006: EIGRP request discarded from 10.11.12.60 to Outside:224.0.0.10
May 17 2018 21:16:43 ftd19 : %ASA-7-710006: EIGRP request discarded from 10.11.12.50 to Outside:224.0.0.10
Here is the final output of the Syslog entries from the FTD device showing the new Lina information in detail. You can see what I typed into the FTD CLI.
May 10 16:27:35 172.23.0.8 %ASA-5-111010: User ‘enable_15’, running ‘CLI’ from IP 0.0.0.0, executed ‘ping tcp lina_mgmt 10.31.44.36 4514’
May 10 16:27:35 172.23.0.8 %ASA-5-111008: User ‘enable_15’ executed the ‘ping tcp lina_mgmt 10.31.44.36 4514’ command.
Using that awesome link and messages listed by Severity Level search bar, I can see that ASA-5-111010 is Severity 5 and:
- %ASA-5-111010: User username, running application-name from IP ip addr, executed cmd
ASA-5-111008 is Severity 5:
- %ASA-5-111008: User user executed the command string
ASA-7-710006 is Severity 7 and:
- %ASA-7-710006: protocol request discarded from source_address to interface_name:dest_address
Although those outputs were pretty damn obvious and I didn’t really need to look them up to see what they do, I think you can see how helpful this can be.
Nice!


HI Todd,
When enabling syslog on ACP, will the Snort Process always sends envet to FMC, then FMC sends the logs to the syslog server.
is there is any way that snort process logs directly send to syslog server.
How many syslog server we can configure in FMC…??
We are having multiple sites and they are managed by central FMC, but we want logs (Lina and Snort) of every location on their location not to the FMC, can we directly send Snort logs to syslog server, as per your document we can have logs from Lina to local syslog, but is it also possible to Snort logs..??
Yes, you can.
You can send Syslog from ACP rules, for example, or from the Platform settings of the devices themselves, and they talk directly to the Syslog servers.
You can configure 16 syslog servers, and each configuration can control the amount of messages and events sent to each server. You can also configure the destinations: console, email, internal buffer, etc.
Appreciate you writing! we do consulting services too, if interested! :)
Todd Lammle
Thanks Todd..:)
Todd, How do I get this information in my SYSLOG data from the FMC?
an 30 08:52:27 FPR2110-LAB-P SFIMS: Protocol: TCP
SrcIP: 172.16.0.101
OriginalClientIP: ::
DstIP: 136.243.5.166
SrcPort: 59143
DstPort: 443
TCPFlags: 0x0
IngressZone: LAN
EgressZone: INTERNET
DE: Primary Detection Engine (61cf9bfe-6c84-11e7-9bbc-b2da5b7afba6)
Policy: FPR2110-DEF-ACP
ConnectType: Start
AccessControlRuleName: internet-access
AccessControlRuleAction: Allow
Prefilter Policy: prefilter-test
UserName: No Authentication Required
Client: SSL client
ApplicationProtocol: HTTPS
InitiatorPackets: 3
ResponderPackets: 1
InitiatorBytes: 691
ResponderBytes: 66
NAPPolicy: Balanced Security and Connectivity
DNSResponseType: No Error
Sinkhole: Unknown
URLCategory: Web Advertisements
URLReputation: Well known
URL: https://dc546.s372.meetrics.net
So that looks like a packet trace, and probably the best way is to get this from your FTD device by configuring the Platform settings.
If you configure the Syslog alerting on the FMC you’ll get information based on your logging setup on your rules in your ACP, but it won’t give you a packet tracer output.
The FTD logging is still underdeveloped and needs work for sure.
I wish I had better answers for you as this is a point of contention for all my customers.
Todd
HI Todd
Can we configure different syslog servers and send to them different message IDs ? if yes, how ?
Thank you
Konrad
Absolutely! You need to do this in the Platform policy and you can configure Syslog with all the MID’s you want.
How ? For example: to syslog server A send message ID X and to syslog server B send message ID Y.
Konrad